
Playing with Tupper's Formula in Julia
Yo!! Welcome....
To recently, i was going through some of the old videos of Numberphile and came across the video The 'Everything' Formula (Before reading this blog just watch the video)
Watching this video, i thought about writing a julia code to make some plots using the formula. So, here we are....
Before going into the code directly, let's first know a bit about the formula.
Introduction
According to wiki
Tupper's self-referential formula is a formula that visually represents itself when graphed at a specific location in the (x, y) plane.
The formula is,
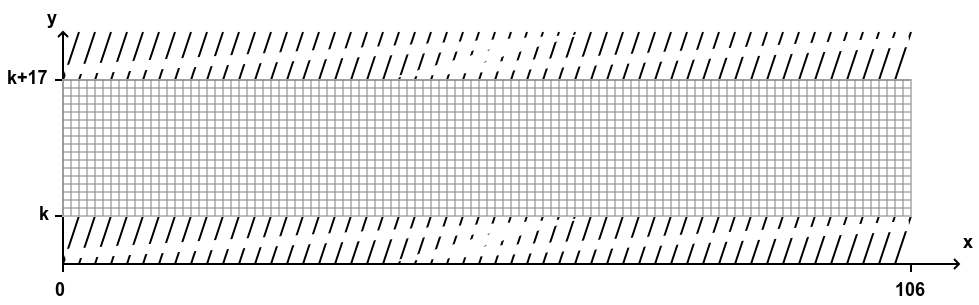
\[ \frac{1}{2}< \Big\lfloor mod\Big(\Big\lfloor \frac{y}{17} \Big\rfloor 2^{-17\lfloor x \rfloor - \mod(\lfloor y \rfloor, 17)},2\Big)\Big\rfloor \]As we can see this is an inequality. If we plot this for \(0 < x < 106\) and \(k < y < k + 17\), then we get the plot,
As we can see the plot is exactly the formula itself for a \(k\) value of
k=4858450636189713423582095962494202044581400587983244549483093085061934704708809928450644769865524364849997247024915119110411605739177407856919754326571855442057210445735883681829823754139634338225199452191651284348332905131193199953502413758765239264874613394906870130562295813219481113685339535565290850023875092856892694555974281546386510730049106723058933586052544096664351265349363643957125565695936815184334857605266940161251266951421550539554519153785457525756590740540157929001765967965480064427829131488548259914721248506352686630476300This is really fascinating. But i don't agree with the fact that it's called self-referential as it does more than that. It actually plots any and every possible thing in a grid of \(17\times 106\). We just have to find appropiate \(k\)-value.
As an example for \(k\)-value of
k_cheenta = 15806189098778893000052913054993993567015366941292274179534053586295503647737517933409233769405785763940088519276398488552677297965783134336600594346427856575753581916591574206800450783605935534858246029155800031822984955455385598121139153589540046302557674614212697588833953815011872377415466312636343196950183648558632777828536170792550924288we will get,
This is the name where I teaches physics. Why not checkout the website of CHEENTA and see my awesome colleagues and students.For a value of,
k_cosmic =1271483917409047962504190716480820125972278621369534229771189155117893513117560028103293542766164054366623611185886118600739414120455650913109912110581287743239969847780541636461645780364303397660529613100638803746819131463964363046325228418810374936998088829255027447274810308302244558096667122081824157031726139625219810246859835932683694862411835356166461473745281741462375240388909870117619294905778805095592609024873542546088290387587421750247353346676976414510740261093361230273514384628199351519546799586984946538836015942052347904we will get,
This is a group which I am part of.
This is really incredible. This fascinating formula was discovered by Jeff Tupper. It first appeared as an example in Tupper's 2001 SIGGRAPH paper on reliable two-dimensional computer graphing algorithms. If you are curious about why or how this works, go through the paper linked.
Here I will only discuss how to implement this in julia code. Maybe in some later blog, I will discuss the why.
Some insight and Finding \(k\) value
The formula is a general-purpose method of decoding a bitmap stored in the constant \(k\) and it could be used to draw any other image. When applied to the unbounded positive range \(0\leq y\), the formula tiles a vertical swath of the plane with a pattern that contains all possible 17-pixel-tall bitmaps. Among all the horizontal slice, one depicts the formula itself, but this is not really special, since other slices depict all other possible formulae that might fit in a 17-pixel-tall bitmap.
This maybe seems too incrediable but is really not.
Notice the size of \(k\). As the formula itself is small and innocuous (just a few exponents, remainders and floors, no “unnatural” functions), and \(k\) is so disconcertingly huge, it is reasonable to guess that all the actual information that produces the graph is contained in \(k\) itself. This would mean that the formula is like a bare-bones “program”, and \(k\) is the “input” that somehow encodes the image that is the graph.
But how the hell \(k\) encode the information? Let's try to undertsand that using an example.
This has 3 steps:
First make a grid of \(106 \times 17\). Then, draw the shape for which we want to find \(k\) value. As an example, let's say we want to draw "a".
This is the grid. Now, we can just draw "a" at one corner.
After drawing this, write \(1\) on each black coloured pixel(box) and \(0\) for the others. This should give something like this(just focus on "a"):
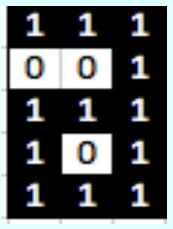
Now, we start from the lower left and write the numbers from bottom to top. This gives us \(11101, 10101, 11111\). i.e., \((111011010111111)_2\).
Finally convert this number into base-10. Then, multiply by \(17\). This gives us the final \(k\) value.
Well, although the method is easy to understand but it's really lengthy. So, if you want to find \(k\), use the following website.
I myself have used this to find the previous \(k\) values.
Julia Implementation
Once we have the \(k\) value, it's very simple. We just check if for particular \((x,y)\), the inequality is satisfied or not. Depending upon that, we just colour the pixel. Here is the code for that:
using Plots
plotlyjs()

function tupper_formula(y, x)
    return 1 ÷ 2 < floor(rem(floor(y ÷ 17) ÷ 2^((17 * x) + rem(y, 17)), 2))
end

function plot_tupper(k)
    width = 106
    height = 17
    img = zeros(Bool, height, width)

    for y in 0:(height-1)
        for x in 0:(width-1)
            img[y+1, x+1] = tupper_formula(k + y, x)
        end
    end

    return heatmap(img, aspect_ratio=1,c=cgrad(:grays, rev=true), flip=false)
end
Now, we just need to call the function plot_tupper. As an example,
k=4858450636189713423582095962494202044581400587983244549483093085061934704708809928450644769865524364849997247024915119110411605739177407856919754326571855442057210445735883681829823754139634338225199452191651284348332905131193199953502413758765239264874613394906870130562295813219481113685339535565290850023875092856892694555974281546386510730049106723058933586052544096664351265349363643957125565695936815184334857605266940161251266951421550539554519153785457525756590740540157929001765967965480064427829131488548259914721248506352686630476300

p = plot_tupper(k)
This generate the first plot(self-referential one).
Few more plots
Here are few more plots.
k_pac = 144520248970897582847942537337194567481277782215150702479718813968549088735682987348888251320905766438178883231976923440016667764749242125128995265907053708020473915320841631792025549005418004768657201699730466383394901601374319715520996181145249781945019068359500510657804325640801197867556863142280259694206254096081665642417367403946384170774537427319606443899923010379398938675025786929455234476319291860957618345432248004921728033349419816206749854472038193939738513848960476759782673313437697051994580681869819330446336774047268864k_euler =2352035939949658122140829649197960929306974813625028263292934781954073595495544614140648457342461564887325223455620804204796011434955111022376601635853210476633318991990462192687999109308209472315419713652238185967518731354596984676698288025582563654632501009155760415054499960k_spand =270887593047695068902177512637039315790870805545237574209083294224566348164515629454108026611013012827103306726993631111616993188494955886640992666873946363041693530171313017819263864013685045445247668181602663772762348140363360641126220335131367302996818140888926115019048960218133602241808439634450714519167159218935381199001214374043071404065825421114593354638235539762000889521529816363996094790128255258340071055083759359335933136601088Not going to give you k value for this one
Calculate \(\sigma\) for \(e^- + e^+ \to \mu^- + \mu^+\) (use feynman's diagram drawn above)As you can see, it's really nice and feels a bit like blackmagic. Hope you enjoyed this.
If you have some queries, do let me know in the comments or contact me using my using the informations that are given on the page About Me.